Marketing audit template: the 6-section framework you score every quarter
A reusable marketing audit template: six scored sections, a 0–5 rubric each, and what 'good' looks like — copy it and run it every quarter.

Most marketing audits die in a Google Doc. Someone runs one once, writes a long list of observations, shares it in Slack, and never opens it again. The audit was a one-time read, not a tool. So next quarter the same questions get asked from scratch, and there's nothing to compare against.
A template fixes that. 64% of marketing leaders say demonstrating marketing's impact on financial outcomes is their single biggest challenge (The CMO Survey, 2025) — and the reason is rarely missing data. It's that nobody scores the same things the same way twice, so there's no trendline to point at. A reusable, scored template gives you one.
This is that template. Six sections, a 0–5 rubric each, a "what good looks like" benchmark for every score, and a weighted roll-up to a single number you can track quarter over quarter. Copy it, fill it in, and re-score it three months later. If you just want the fast version, the 30-minute, 5-step marketing audit is the checklist you run weekly — this is the deeper artifact you graduate to.
Key Takeaways
- A marketing audit template is a reusable, scored scorecard — not a one-time read. The point is comparability: a number you can track quarter over quarter, not a list you write once.
- Score six sections 0–5 against a benchmark: positioning, funnel, channels, content, measurement, and competitive. Weight them (positioning highest), don't average them.
- Brand consistency can lift revenue 10–33% (Marq, 2024), which is why positioning carries the most weight — it sits upstream of every other section.
- 64% of marketing leaders can't prove marketing's financial impact (The CMO Survey, 2025). A scored template is the trendline that makes the case for you.
What is a marketing audit template?
A marketing audit template is a structured, reusable framework that scores your marketing across fixed sections — positioning, channels, funnel, content, measurement, and competitive — so you can run the same review every quarter and watch the number move. It's an asset you fill in and file, not a process you walk through once and forget.
That's the line between this and a checklist. A checklist is a verb — a thing you do. The 30-minute marketing audit checklist is five steps you run on a Tuesday to catch what's breaking this week. A template is a noun — a thing you have. You score it, save it, and compare next quarter's version against this one. Both matter. They just run on different cadences and answer different questions.
The reusability is the whole point. Marketing budgets sit flat at 7.7% of company revenue, unchanged for two years running (Gartner, 2025). There's no budget bailout coming, so the leverage is in pointing the same hours at the right gap — and you can't see the gap without a baseline. A template that produces a score is how you build the baseline.
Who is this for? In-house marketers at a 6-person SMB, the marketing person at a small team, an agency owner running this on behalf of a client. Anyone who'll be asked "is marketing working?" and wants a defensible answer instead of a feeling.
What should a marketing audit include?
A complete marketing audit includes six sections, each scored against a benchmark: positioning, funnel and conversion, channels, content, analytics and measurement, and competitive. Skip any one and you get a blind spot — usually measurement, which is the section small teams most often leave out and most often need.
According to The CMO Survey, 64% of marketing leaders rank proving financial impact as their hardest problem (The CMO Survey, 2025), yet measurement is the section teams cut first because it's the least fun to face. A good template forces all six, so the uncomfortable section gets a score instead of a skip.
Here's the full template at a glance. Each section carries a weight — they're not equal. Positioning sits upstream of everything (a clear message makes every channel, page, and ad work harder), so it counts most. Competitive matters but moves slowest, so it counts least.
| Section | What it measures | Weight |
|---|---|---|
| 1. Positioning | Is your message clear and genuinely different? | 25% |
| 2. Funnel & conversion | Where prospects leak between stages | 20% |
| 3. Channels | Where you show up, and whether the mix works | 15% |
| 4. Content | What's earning attention vs. sitting dead | 15% |
| 5. Analytics & measurement | Whether you can actually prove ROI | 15% |
| 6. Competitive | What rivals do differently, and your gap | 10% |
The scoring rubric is the same in every section: rate it 0 to 5 against the benchmark, where 0 is absent or actively hurting, 3 is adequate, and 5 is a competitive asset. The "what good looks like" note under each section is the 4–5 description — the target, not the average.
The marketing audit template, section by section
This is the asset. Copy the six blocks below into a doc, score each one, and keep the scores. Every section has the same shape: what you're auditing, what to check, the 0–5 rubric, and what good looks like.

1. Positioning — weight 25%
What you're auditing: whether a stranger can tell, in one breath, who you sell to, what you sell, and why it's different. This sits upstream of every other section — fuzzy positioning makes good channels, pages, and ads underperform.
Check:
- Read your homepage hero out loud. Does it name the buyer or the outcome (good), or describe the product category (weak)?
- Could a competitor copy-paste your hero and have it still ring true? If yes, you have category description, not positioning.
- Is your value prop a sentence a customer would say back to you, or internal marketing-speak?
Scoring (0–5): 0–1 = no clear message, or it could belong to any competitor. 2 = clear what you do, not why you're different. 3 = clear and differentiated, but buried in jargon. 4–5 = a stranger gets buyer + product + difference in one read, and it's hard to copy.
What good looks like: one sentence anyone on the team says the same way. Consistent brand presentation across channels can lift revenue 10–33%, yet only 30% of organizations actually use their brand guidelines (Marq, 2024). A 4–5 here means the message is both sharp and used everywhere.
2. Funnel and conversion — weight 20%
What you're auditing: where prospects leak between stages, measured against benchmarks rather than gut feel. The leakiest stage is rarely the one your dashboard makes most visible.
Check:
- Plot one number per stage for the last 90 days: visitor → lead → qualified → opportunity → customer.
- Line each up against benchmarks. Your biggest gap-to-benchmark is the break.
- Is the leak a volume problem (not enough in) or a conversion problem (enough in, not enough through)?
Scoring (0–5): 0–1 = you can't see stage-to-stage numbers at all. 2 = you see them but never compare to benchmark. 3 = roughly at benchmark, one obvious leak. 4–5 = every stage at or above benchmark, leaks caught early.
What good looks like: the median B2B SaaS landing page converts at 3.8%, and average lead-to-customer runs near 1.1% (First Page Sage, 2024). A 4–5 means you're at or above those and know your single weakest stage by name.
3. Channels — weight 15%
What you're auditing: where you show up, whether the mix is intentional, and whether any single channel is a silent point of failure. More channels isn't automatically better — but one-channel dependence is fragile.
Check:
- List every active channel and its share of leads or revenue. Is one channel quietly carrying 80%?
- Which channels are you on out of habit vs. because they convert?
- Is there a channel your ICP actually uses that you've ignored?
Scoring (0–5): 0–1 = a single channel with no backup, or channels chosen by habit. 2 = a few channels, no idea which performs. 3 = a known primary plus one or two real secondaries. 4–5 = an intentional mix, each channel measured, no single point of failure.
What good looks like: campaigns using three or more channels earn a 287% higher purchase rate than single-channel campaigns (Omnisend, 2023). A 4–5 means a deliberate mix where each channel earns its place — and your organic surface (covered in the SEO audit guide) is measured, not assumed.

4. Content — weight 15%
What you're auditing: which pages do the work, and whether they're maintained — not how much content you have. Volume is the trap; maintenance is the lever.
Check:
- Pull your top 10 pages by traffic and top 10 by conversions. The union is your real content surface; the rest is archive.
- When was each top page last updated? Anything over 12 months old is refresh debt.
- Does your content answer questions your ICP actually asks, or topics you find interesting?
Scoring (0–5): 0–1 = no idea which pages perform, nothing updated in a year. 2 = you know your top pages but never refresh them. 3 = top pages identified, refreshed occasionally. 4–5 = top 10 maintained like product surfaces, refreshed on a schedule.
What good looks like: refreshing a single decaying post lifted its weekly traffic 55% (Animalz, 2023). A 4–5 means your best pages are treated as assets you maintain, not posts you published and abandoned.
5. Analytics and measurement — weight 15%
What you're auditing: whether you can actually prove what's working. This is the section small teams skip most — and the one that decides whether the audit changes anything next quarter.
Check:
- Can you tie revenue or pipeline back to a channel? If not, what's missing — tracking, attribution, or just the habit of looking?
- Are you using the tools you already pay for? Most teams aren't.
- Do you have a baseline number to compare this quarter against last?
Scoring (0–5): 0–1 = no reliable numbers, decisions on vibes. 2 = data exists, scattered, rarely opened. 3 = core metrics tracked, reviewed monthly. 4–5 = clean attribution, a baseline, decisions tied to numbers.
What good looks like: marketers use just 33% of their martech stack's capabilities (Gartner via MarTech.org, 2023). A 4–5 doesn't mean more tools — it means you actually use the ones you have and can point to a trendline.
6. Competitive — weight 10%
What you're auditing: what competitors say and do differently, so you can say something sharper. Marketing's job here isn't to copy — it's to find the gap you can credibly own.
Check:
- Open a top competitor's homepage, pricing, and last three posts. What one outcome do they lead with?
- Write one sentence: the gap I can own that they aren't.
- Are you tracking competitors anywhere, or finding out about moves from customers?
Scoring (0–5): 0–1 = no competitive visibility, surprised by rival moves. 2 = you know who they are, not what they're saying. 3 = you check competitors occasionally and have a rough difference. 4–5 = a clear, sharp gap you own, refreshed regularly.
What good looks like: 68% of B2B deals involve at least one direct competitor, yet 44% of companies have no competitor visibility in their CRM (Crayon, 2025). A 4–5 means one credible sentence on your difference — which already puts you ahead of nearly half the field.
How to score and roll up your marketing audit
Once every section has a 0–5 score, roll them into one number. Multiply each section score by its weight, normalize to 100, and you get a marketing health score you can track. The math is deliberately simple — a roughly-right score you'll actually re-run beats a precise one you won't.
The mistake almost everyone makes is averaging the six scores. Don't. A 5 in competitive doesn't offset a 1 in positioning, because positioning sits upstream — fix it and every other section improves; ignore it and the rest can't compensate. Weighting forces the score to reflect that. That's why a flat average lies and a weighted roll-up tells the truth.
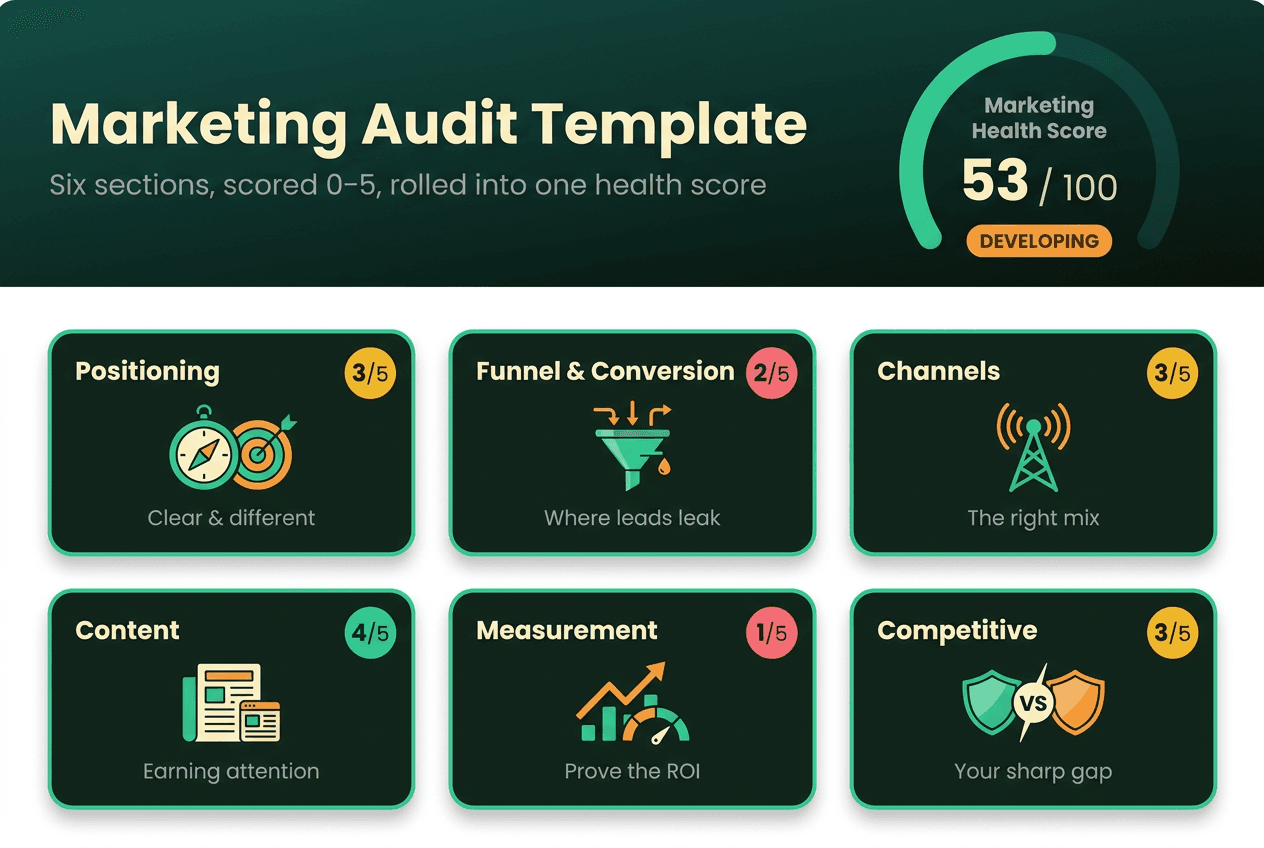
Here's a worked example. Say you score positioning 3, funnel 2, channels 3, content 4, measurement 1, competitive 3. Weighted: (25×0.6) + (20×0.4) + (15×0.6) + (15×0.8) + (15×0.2) + (10×0.6) = 53 out of 100. That's "developing" — and the measurement score of 1 is screaming where the quarter's work goes.
Our take: the number matters less than the direction. A 53 that was a 44 last quarter is a team that's winning. A 71 that was a 78 is a team with a leak it hasn't named yet. Re-run the template each quarter and the trendline does the arguing for you — which is exactly the proof 64% of marketers say they're missing.
How often to run it, and what to do with the score
Run the full template quarterly. The weekly 30-minute checklist catches what's breaking now; the quarterly template tracks whether the whole system is getting healthier. Different cadence, different job. Trying to run the deep version weekly just means you stop running it.
The pattern I see most: the lowest-scoring section is almost always measurement, and the highest-leverage fix is almost always positioning. Teams want to fix the channel that feels broken. The template usually says fix the message first — because a 1 in positioning is quietly capping the ceiling on every other section's score.
So the move after scoring is narrow: take the lowest-scoring high-weight section, make it the quarter's focus, and leave the rest. One fix, scored, beats six half-fixes nobody measures. If you're a marketing team of one, this discipline is the difference between compounding and spinning. The template tells you which single thing earns the quarter.
How Sivon runs this audit automatically
Filling six sections by hand is the honest way to learn the framework. Running it every quarter by hand is the part that slips. That's the gap Sivon closes.
Sivon is an AI marketing team that diagnoses what's broken before it creates anything. You set up a Brand Blueprint once — your positioning, ICP, voice, and proof — and Sivon scores every section of this template against it automatically: positioning, channels, funnel, content, measurement, and competitive, each with a number and a "what good looks like" gap. The same six-section audit you'd run by hand, scored in minutes and re-scored whenever you ask.
The Blueprint is why the score is yours and not generic. A diagnosis that could apply to any business is worthless; one that knows your category, your buyer, and your edge is the second opinion you check before committing a quarter to one fix. Run the diagnosis to see your score across all six sections, and check pricing for what the always-on version costs.
The template above is free, reusable, and yours to keep. Copy the six blocks, score them, file the number. Then re-run it next quarter — by hand or automatically — and let the trendline make your case.